Back to Design Portfolio
Web App · Case study
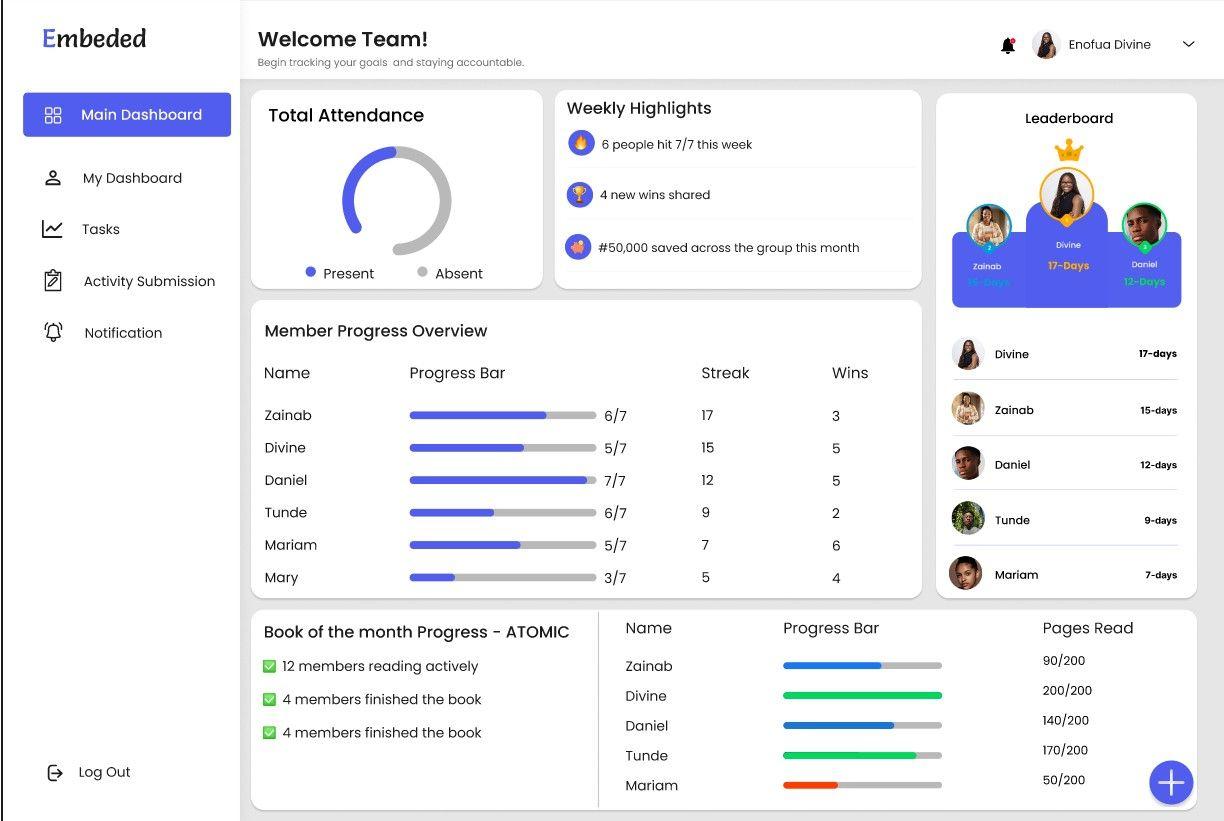
Embeded Dashboard
A goal-tracking dashboard that turns progress data into clear, scannable insight.
Project type
Web App
My role
Product Designer — information architecture and dashboard UI.
Tools
Figma · Design Systems
The problem
Teams tracking goals and attendance need to see where they stand at a glance, without digging through tables.
Process
- 01
Understand
Listed the numbers people check most often and ranked them by importance.
- 02
Structure
Grouped related data into clear cards and a simple left-hand navigation.
- 03
Design
Used a light, calm interface with colour reserved for status and progress.
- 04
Refine
Tuned spacing, type scale and table density for quick scanning.
Key decisions
- Placed the highest-value summary data at the top of the page.
- Reserved colour for meaning — progress, warnings and status.
- Kept tables compact but readable so dense data doesn't overwhelm.
What I learned
A dashboard is successful when someone can answer their main question in five seconds.
Like what you see? Let's design something together.
I love being part of the process that brings them to life.